


Measuring forces during DNA segregation

Bio
I hace a background in physics and nanoscience. I'm curious and adventerous, you can explain a lot of me and what I'm doing based on these traits. I like humans and fascinated by their behaviors, thoughts, rituals and cultures. Beside the hard science, I'd like to read/listen about psychology, evolution and human development meta-narratives. Living in the Netherlands, I miss mountains and hikings a lot. My after work routines are always gym and then practicing a Persian traditional music instrument called Tar.
Project Summary
We use DNA origami folded into a nanospring as a force sensor. Proteins involved in chromosome segregation (such as the Ndc80 complex) are attached to the nanospring. When these proteins tip-track a depolymerizing microtubule, they stretch the nanospring. Using TIRF microscopy, we can monitor this extension, and by measuring the fluorescent signal, we can estimate the amount of force the proteins are able to capture.
Introduction
Microtubules, dynamic cytoskeletal filaments, generate pushing and pulling forces during polymerization and depolymerization, playing critical roles in cellular processes such as mitotic cell division. These forces are particularly important at the kinetochore–microtubule interface, where protein complexes like Ndc80 mediate chromosome segregation by coupling microtubule dynamics to force generation. The Ndc80 complex, comprising Hec1, Nuf2, Spc24, and Spc25 subunits, facilitates microtubule binding and force transmission, with its efficiency enhanced by oligomerization (approximately 15–25 complexes per microtubule in physiological kinetochores). The unstructured N-terminal tail of Hec1 and the Ndc80 loop further stabilize these interactions.
Quantifying microtubule-generated forces is challenging in vivo due to crowded cellular environments and complex force interactions. Traditional in vitro methods, such as optical trapping, offer high-resolution force measurements but require sophisticated equipment and face limitations like force asymmetry and technical complexity when combined with single-molecule fluorescence imaging. To address these challenges, a novel method using DNA origami nanosprings has been developed. These nanosprings, assembled from folded DNA strands, serve as force sensors by measuring extension, enabling simultaneous force and fluorescence measurements with only a fluorescence microscope. Validated against optical trapping, nanosprings accurately measure forces from dynein motors, growing microtubule ends (via EB3 and SxIP motifs), and shortening microtubule ends (via Ndc80 and Ska complexes).
Using a truncated Ndc80 variant, Ndc80jubaea (jubaea), engineered nanospring constructs with controlled valency (3–20 copies) reveal that increasing jubaea copy number enhances microtubule interaction frequency, promotes rescue and stall events, and reduces depolymerization rates. Optimal force transmission (~2.15 pN) occurs with 10 jubaea copies, while higher copy numbers (15–20) further influence microtubule dynamics, mimicking physiological kinetochore behavior. This approach provides insights into how Ndc80 stoichiometry regulates force transmission and microtubule dynamics, offering a simpler, accessible method for studying kinetochore–microtubule interactions in vitro.
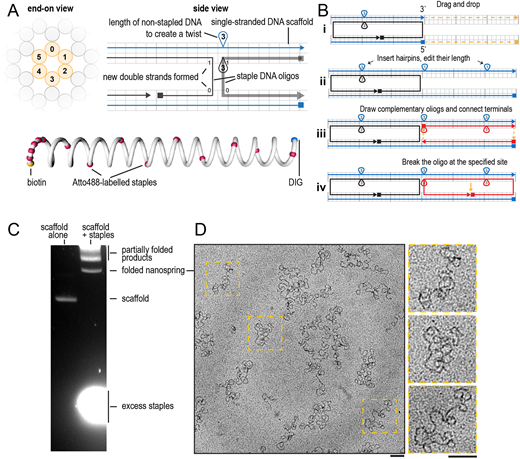
Nanospring representation in caDNAno and quality control of folded nanospring by agarose gel electrophoresis and electron microscopy. (A) An example of a slice panel (left) and a path panel (right) of the DNA origami design in caDNAno. Below: a schematic illustration of the nanospring with colour-coded staples (yellow, biotin; red, fluorescently labelled staples; blue, DIG). (B) Step by step visual guide to extend an existing nanospring design using caDNAno. (C) Purification of nanosprings by agarose gel electrophoresis. The left lane shows migration of unfolded scaffold in absence of staples, the right lane is loaded with staple-scaffold mixture after temperature cycling and contains the products of folding. (D) Transmission electron microscopy of nanosprings negatively stained by 2% uranyl acetate. Enlarged images of the indicated regions are shown on the right. Scale bars: 100 nm. Images in C and D are representative of 11 experiments.
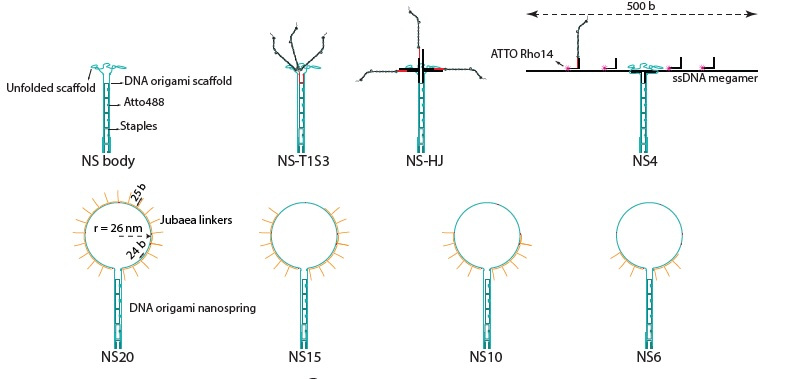
DNA origami nanospring as a force sensor and a platform for multimerization of jubaea. (A) From left to right respectively, upper row: schematics of a NS with no jubaea binding
linker, jubaea trimer made by modified streptavidin (T1S3 construct) attached to nanospring, jubaea trimer formed using a holiday junction at the terminus of NS, a 500 b ssDNA connected to NS to accommodate 4 jubaea copies. Lower row: oligonucleotide handles connected to the NS scaffold that can allow binding of up to 6, 10, 15 and 20 jubaea copies.

Capturing the force of depolymerizing MTs by NS-jubaea complexes (A) Schematics of experimental setup of force measurement. (B) Time lapsed images of a shrinking MT (magenta) encountering an NS (cyan) with DNA labeled jubaea hybridized to its terminal (yellow). The jubaea oligomer follows the shrinking end of the MT and extends the NS. The extension reaches to its maxium at t = 440.1 s. The kymograph of this event is provided below the time-lapsed images. Scale bars: Temporal 60 s, spatial 5 μm. (C) A kymograph of an NS extension event, visualized in the NS channel. A Gaussian function was fitted to the fluorescent signal of the NS in the kymograph to obtain the position vs. time data points. An example of NS position tracking is provided for the two NSs in the example kymograph. The extension length was defined as the maximum displacement of the NS from its median position as a result of its interaction with a depolymerizing MT. (D) Quantification of the forces captured by different NS-jubaea complexes, in the absence or in some cases presence of free jubaea in solution. The cyan datapoints are the forces captured by T1S3 construct with the full length Ndc80. Horizontal lines show mean values, error bars are S.D and statistical significance was determined using a two-tailed Mann–Whitney test. (P-values; NS-T1S3 FL vs. NS-T1S3: NS10 vs. NS15: 0.2836, NS6 vs. NS15: 0.1597, NS-T1S3 vs. NS-T1S3 (+ free T1S3): 0.1087, NS4 vs. NS4 (+free jubaea): 0.0223, NS-HJ vs. NS-HJ (+ free jubaea): 0.0056, NS20 vs. NS20 (+ free jubaea): 0.0570, NS6 vs. NS10: 0.0202)


